Over the last few years, the mathematics department at Rutgers has introduced various new formats for its Calculus courses. Since the traditional large lecture/recitation format is still being offered, it is possible to compare methods. This study tries to do just that: to determine the effect of the new formats upon students' performance in calculus.
For this study, we examined the first semester Calculus course Math 135: Calculus for liberal arts majors. The Fall, 1999 Math 135 course contained almost 1600 students, divided into 54 sections of about 30 students each. About 85% of the students taking math 135 were enrolled in the traditional large lecture/recitation format, while the rest were enrolled in the newer and smaller workshop/practicum format. The numbers in both groups were sufficiently large enough to distinguish between actual differences and statistical fluctuation, and to filter out the effects of any one teacher, course time, or college.
Student performance in the course was measured by the common final exam for the course, a test taken by 90% of all students. Each student's "ability" coming into the course was measured by the Math SAT score, the scores on the Rutgers Precalculus Placement Test, and their high school rank.
Our results may be summarized as follows: After adjusting for ability, the students in the workshop/practicum sections outperformed the large lecture/recitation sections by slightly over one letter grade on the final exam (e.g., from C to B or B+). This was surprising since, based upon their ability levels, we had expected the students in the workshop/practicum sections to have lower final exam scores than the students in the large lecture/recitation sections.
In order to obtain more detailed results, we analyzed first-year students separately from upper-year students, and stratified these groups according to ability.
For first year students, the best predictor of final exam grade was the Rutgers Precalculus Placement Test (PRECAL). There was a moderate correlation (0.45-0.55) between the placement score and the final exam score. However, we found a significant improvement by the workshop/practicum students at all ability levels.
For upper year students, the placement test was a less reliable predictor. The small number of upper-year students in the workshop/practicum meant that we could not draw any definitive conclusions about the effect of this format on low or high ability upper year students. However, for upper year students in the middle range (measured by Math SAT) there were pronounced differences favoring the workshop/practicum format.
This is the second of several studies undertaken by the Rutgers Mathematics Department, as an attempt to determine the relative effect of the new teaching formats. The first part [W] compared the different formats in which we teach Math 151-152, which is the Calculus sequence for the Mathematical and Physical Sciences, and the EXCEL sequence, Math 153-154. None of the sections of Math 151-152 use the lecture/recitation style used in Math 135; most use a 4-credit Workshop format not present in Math 135, and some use the 5-credit workshop/practicum format discussed here. The third part of this series [WH] will study the effect of Precalculus on the performance of upper-year students in Math 135, a study which is beyond the scope of this report.
2. Strong students can improve their final exam score by about 25 points
by taking the Practicum; this amounts to one letter grade. However,
we believe that a more important consideration is that the
workshop/practicum format better prepares students for collaborative
projects in other scientific fields.
3. We strongly recommend the Practicum for weaker students; it may mean
the difference between passing and failing the course. Advisors should
point out to students that the short-term disadvantage of spending
extra time on a Calculus course, and using an extra course credit, is
outweighed by the possible cost of repeating the course later.
4. In trying to determine the student's preparedness for Calculus, the
Rutgers Precalculus Placement test (the Level II Placement Test) should
be given more weight than the Math SAT scores.
5. We also recommend that the workshop/practicum format not be offered
first period.
Since 1997, there has been an alternative 5-credit format in Math 135.
We will refer to this as the "Practicum" format, since the additional
55-minute class is given a separate course number and the name Practicum
by the university registrar. Again, two 80-minute periods are devoted to
traditional lectures. In addition, the students meet twice more a week,
in 55-minute classes. One of these is a traditional recitation, in which
a teaching assistant goes over the routine homework. The other 55-minute
class is held in a workshop format, described below, and is run
by the lecturer and a peer mentor.
In order to understand why the math department chose the "Practicum" format
for Math 135, it is useful to rapidly review how it evolved.
In 1990, Rutgers initiated a 6-credit pilot program called EXCEL for
first-year calculus students. Based on a program at Berkeley, it replaces
the one recitation with three full periods per week devoted to workshops.
The workshops involve collaborative learning in small groups of 3-4
students. In addition, students are now being asked to write up expository
solutions, explaining in complete sentences how they arrive at their answer.
EXCEL was an immediate success. Not only did we notice an increase in
grade point averages over several years, but we also observed fewer losses
in the number of technical majors. In addition, other departments have
supported EXCEL because they have found that EXCEL students were better
able to engage in collaborative learning projects. Since 1990, EXCEL has
become a standard course offering, and given the designation Math 153-154.
Encouraged by the success of the EXCEL program, in 1995 the math department
changed the way it offered Math 151-152: Calculus for the mathematical
sciences, the physical sciences, and engineering. In order to keep the
4-credit course load, each section of Math 151-152 meets 3 times per week,
with two 80-minute periods being devoted to traditional lectures. In the
third period, increased from 55 to 80 minutes, the students meet in a
recitation/workshop format. These classes are led by a teaching assistant
and a carefully selected undergraduate, called a peer mentor.
Typically, the first 20 minutes are spent going over the routine homework
problems. In the remaining hour, the students break up into small workshop
groups (of 3-4 people) and attempt more challenging problems, which are
distributed as a handout. One of these workshop problems is assigned to be
written up in the next week, and graded for both mathematics and exposition.
During 1995-1996, it became clear that there was a demand for more
homework review. Starting in Fall 1996, the 5-credit "Practicum" version of
Math 151-152 was created. It is identical to the Practicum version of
Math 135 described above: two 80-minute lecture periods, supplemented by
two 55-minute classes per week for homework review and workshop. This format
was introduced into Math 135-136 in Fall 1997. The workshops were
modified in 1998, based upon student course comments. Data for this study
was collected for the Fall 1999 course.
In the Large sections there were 1482 students; 71% passed and we had
valid data for 1117 students. Of these, 767 were first-year students and
350 were upper-year students. We could not obtain final exam data for
three sections, and 204 other students did not take the common final exam:
93 first-year students and 111 upper-year students. One large recitation
section (22) had low exam scores, but we did not exclude this data because
the difference was not statistically significant.
In the 6 Practicum sections there were 112 students; 86% passed and
98 students took the common final exam. Of these, 80 were first-year
students and 18 were upper-year students. Of the 8 first year students and
6 upper-year students who did not take the common final, six withdrew,
six failed and two received a 'C' grade.
The average Final Exam scores, without adjusting for ability were as follows.
For the Large sections, the average Final Exam score was 124; the average
Final in the Practicum sections was 139. This difference represents an
increase of about half a letter grade (e.g., from C+ to B). Since the
standard errors in these estimates were 1.34 and 3.88, the difference is
very significant. It is also surprising, because the students in the
Practicum sections had lower SAT and Precalculus placement scores.
(See Table 1.) We will see below that when we incorporate the placement
information into our model the differences become twice as large.
The Large/Practicum differences were reflected in the course grades as well:
the average grade of all first-year students (counting F, W and Z grades
as zero) was 1.93 (low C) in the Large sections, and 2.41 (C+) in the
Practicum sections. Of course, grades are not reliable indicators of
performance for many reasons.
The Final Exam scores for first-year students had a markedly different
distribution than for upper-year students. Restricted to the
847 First-year students, the average Final Exam scores were 136.3 (Large)
and 145.9 (Practicum). The scores fit a Poisson distribution (See Figure 1),
which is typical of an exam where there are many problems and mistakes are
infrequent.
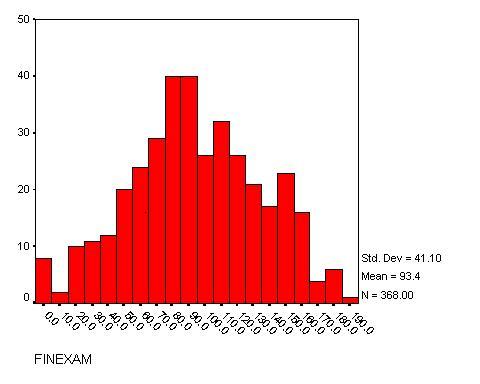
There was a similar difference when we restricted to the 368 upper-year
students. The Final Exam scores averaged 92 (Large) and 111 (Practicum),
respectively. This difference represents an increase of one full letter
grade, from F to D. Again, since the standard errors in these estimates were
small (2 and 8, respectively), the differences were significant at the
95% confidence level. Here the scores fit a normal (bell-shaped)
distribution (see Figure 2), which is more typical of an exam in which
there are many problems and mistakes are common.
One reason for the different profile between first and upper year students
is that the Placement scores of upper year students averaged only 14.5,
which is far below the cut-off score of 20 for placement into Calculus.
However, these placement scores are not as meaningful for upper year
students because they do not reflect the fact that about 80% have taken
subsequent college-level Math courses at Rutgers, and 43% have already
taken Calculus at Rutgers. These issues do not concern the effect of the
Practicum format, and will be the subject of a separate study [WH].
In our more detailed analysis, we excluded section 74, because it
contained abnormally many low Final Exam Scores. We think this may be due
to the fact that section 74 met at 8:10 AM, four days a week. We ruled out
the choice of instructor as a factor in this case, as the same instructor
also taught a large section in which students had a score distribution
similar to other large lectures.
In order to take Calculus I at Rutgers-New Brunswick, all students must
either pass the New Brunswick Precalculus placement exam (the PRECAL) or
else have passed a precalculus course. PRECAL is scored from 0 to 35;
a score of 20 or higher qualifies them to take calculus. We had the PRECAL
scores for all first-year students, and for almost all upper-class students.
The average PRECAL score was 26.0 for the first-year students in our sample.
About 1% of all first-year students had PRECAL scores below 20, but were
allowed into Math 135 if they had taken Precalculus over the summer. The
PRECAL scores for upper-year students ranged from 0 to 35, averaging 14.5.
In addition, our database contained admissions information. We had both the
Math SAT (MSAT) and Verbal SAT (VSAT) scores for all first-year students in
our database, their High School Rank (HSRANK), measured as a percentage,
and their gender (male/female). The Math SAT scores ranged from 370 to 800,
and the High School Rank ranged from 18% to 100%.
The Practicum students were weaker when the semester began, even though
they ended up strongly outperforming the students in the Large sections.
The Precalculus placement scores were 26.0 (large) and 24.6 (Practicum)
and the average Math SAT scores were 643 (large) and 630 (Practicum).
As mentioned above, the students in the Practicum sections had lower
scores on both SAT tests, PRECAL score, and High School Rank. There was
almost no difference in ability or performance by gender, either in the
large or Practicum sections.
About 10-15% of all students did not take the common final exam. In order
to determine how our database was skewed by omitting them, we analyzed the
course grades of those students who did not take the common final.
There was a consistent ratio of 95% failing and 5% passing the course,
independent of any of the indicators: large vs. practicum, first-year vs.
upper-year, large first-year vs. etc. These ratios are consistent with the
hypothesis that make-up exams do not introduce any bias in our analysis.
In order to determine how incoming students were placed into the Practicum
sections in Fall 1999, we interviewed the Academic Service Deans of the
four major Colleges (Cook, Douglass, Livingston, and Rutgers) represented
by the students in Math 135. Although there are differences between the
colleges, all incoming students self-selected whether or not to take the
Practicum section based upon a short college presentation given during
May/June of 1999. At this time they knew their SAT scores but not their
Placement scores. Although most college deans suggested that Practicums
were for stronger students, the data indicates that the SAT scores of
students registering in Practicums were in fact slightly less than the
scores of students in the large sections.
All the variables in our database were correlated with each other.
The highest correlation was between the PRECAL score and the Final:
0.46 (large sections) and 0.60 (Practicum). At the 99% confidence level,
the Final Exam score was also significantly correlated with the Math and
Verbal SAT scores, as well as the High School Rank. However, these four
predictor variables were also correlated to each other. This correlation
was particularly significant in the large sections, because the higher
number of students eliminated more random fluctuation.
A stepwise linear regression was performed upon the first-year data in order
to adjust for this correlation. The most significant predictor in both the
Large and Practicum sections was the Precalculus Placement score, PRECAL.
The second was High School Rank for the large sections, and verbal SAT for
the Practicum section.
The linear regression models using these variables are given in Table 2,
and the scatter plot is shown in Figure 3.
Practicum FINAL = (5.08)PRECAL + 28
The linear model predicts that a student with an average placement score
(i.e., 26) would score 134.8 (a C+) in the large section, and 160.1 (a B+)
in the Practicum section. For student with the minimum allowed placement
score of 20, the model predicts a score of only 103.2 (an F+) in the large
section, but 129.6 (a C/C+) in the Practicum section. For a student with
a high placement score of 32, the model predicts a score of only 166.3
(a B+) in the large section, but 190.6 (an A+) in the Practicum section.
In all cases, the model predicts an improvement of one full letter grade.
The significance of these regression models is measured by the multiple R,
the correlation between the final exam scores the combination of independent
variables in the models above; the value of R-squared represents the
proportion of the total sample variability explained by the linear model.
For the models in Table 2, the multiple R was positive:
.49 and .55 respectively for the models in the large sections,
and .65 and .70 respectively for the models in the Practicum sections.
One possible explanation for the appearance of the Verbal SAT in the
Practicum model is that the exposition component of the Workshops may
encourage students to think about the material in new and useful ways.
To further test this model, we broke down the students into groups based
upon their Math SAT scores. These scores would be available to the students
during the May/June orientation, when students decide which section to
register for. The Final Exam scores for each SAT range is given in Table 3.
Most first-year students in Math 135 had SAT scores between 550 and 750,
with an average of 643. Here we see a consistent pattern of a 10-20 point
improvement across all SAT levels.
Most upper-year students in Math 135 had SAT scores between 450 and 700,
with an average of 566. Because of the small number of students in each
SAT range, it is difficult to draw many conclusions about upper-year
students, but we do see a pattern of improvement. In the middle range
500-600, the upper-year students did as well in the Practicum sections as
the first-year students did. This contrasts with the Large sections,
where the upper-year students in the middle range did decidedly worse than
the first-year students of comparable ability.
When adjusted for ability level, first-year students in the Practicum
outperformed students in the large lecture/recitation sections by more
than one letter grade: (e.g., from C to B or B+). In fact, even though
the Practicum students had started the semester with slightly weaker
ability than the Large lecture students they finished with a significantly
higher Final Exam average. This strong positive effect for freshmen was
apparent at all ability levels.
Upper year students in the Practicum sections also outperformed upper year
students in the large lecture/recitation sections by more than one letter
grade. However, they had much lower scores on the final exam than the
first year students. This was somewhat expected since in general they
started the semester with lower scores in their quantitative abilities.
Their low Precalculus placement scores are not a reliable predictor,
as they do not reflect subsequent college-level Math courses. When broken
down according to SAT levels there is a clear pattern of improvement
but there are too few students to be able to draw any firm conclusions.
One surprising discovery was that most of the abnormally low scores
came from the same section, which met first period four days a week.
We conclude that first period Practicum sections should not be offered.
Further study is required in order to determine the reasons for the weak
performance by the upper year students on the final exam. This does not
seem to be a question of large section versus Practicum section, but
rather one of what kind of Precalculus preparation is appropriate for
students with weak quantitative skills. This will be addressed in [WH].
Finally, we can combine this study with the study [W] of Math 151
and make a positive comparison between the current 4-credit Workshop version
of Math 151 and the 4-credit lecture/recitation format it replaced.
Consider a first-year student with a Precalculus Placement score of 26.
In the present study we found that this student would score 26 points better
(out of 200) in the Math 135 Practicum than in a large lecture/recitation
section of Math 135. In the other study [W] we found that this student
would score 12.5 points better (out of 200) in the Math 151 Practicum than
in a Workshop section of Math 151. The Final Exams in the two Calculus
courses have similar structure (e.g., both allow calculators, give partial
credit and take 3 hours) and the scores had similar (Poisson) distributions.
We believe that it is reasonable to conclude that our hypothetical student
would show an improvement in Final Exam scores of 10-15 points (about half
a letter grade, from C+ to B). That is students in the current 4-credit
Workshop format of Math 151 are learning significantly more that they were
in the old 4-credit lecture/recitation format.
[WH] L. Hirsch and C. Weibel, Precalculus preparation for Calculus,
in preparation.
Recommendations
1. All students, weak or strong, do better in the workshop/practicum format
than in the large lecture format. We recommend that more students should
take these sections.
The Formats used in the courses
Until recently, all Math 135 courses at Rutgers were taught in a traditional
4-credit format, consisting of two 80-minute lectures and one 55-minute
recitation each week. Most sections of Math 135-136 (48 out of 54) are
still taught that way. We will refer to this as the "Large" format, since
currently each lecture contains three sections, and about 90-100 students.
Average Final Scores
In Fall 1999, there were 48 Large sections and 6 Practicum sections.
Class         # of  Average(mean)        Math  Precalc    HS   Verbal
Format       Exams and Std. Error Grade  SAT   Placement  Rank  SAT
------        ---- -------------- -----  ----  ---------  ---- -----
Large          767  135.0  1.4    1.93   643     26.0     85.7  595
Practicum       80  145.9  3.9    2.41   630     24.6     80.0  585
Pract. (not 74) 67  150.5  4.0    2.79   629     24.5     80.0  581
Table 1. Final Exams from Math 135 in Fall 1999
(First-year students only)
Figure 1: Final Exam distributions for first-year students
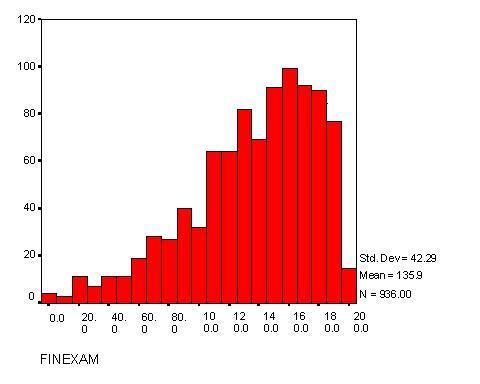
Figure 2: Final Exam distributions for upper-year students
Database Information
We had a large database of placement scores for first-year students,
which we were able to combine with the final exam scores for Calculus.
Linear Regression Model
There was a clear relationship between the strength of a student, measured
by the SAT scores and Placement tests, and how they did on the Final Exam.
To adjust for this relationship, we used a linear regression model.
Figure 3: Final Exam Scores versus Placement scores (first-year students)
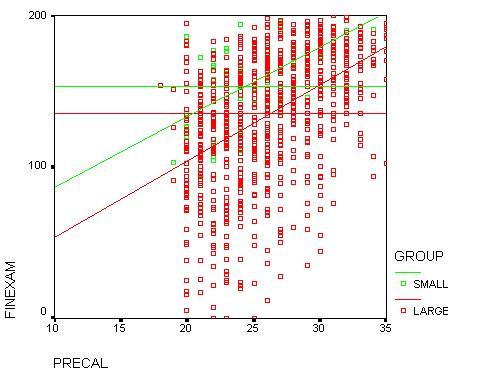
Large sections FINAL = (5.26)PRECAL - 2
= (4.84)PRECAL +(.96)HSRANK - 75
= (4.34)PRECAL + (1.04)VSAT - 13
Table 2. Linear Regression models for Math 135 Final Exam
(Fall 1999, First-year students excluding section 74)
	  Math   First-year      Upper-year
	  SAT    LGE  PRACTICUM  LGE  PRACTICUM
	-------  ---  ---------  ---  ---------
	200-440   -      -        79     67*
	450-500   89    120*      83     74*
	510-550  109    125       85    109*
	560-600  117    139       87    136
	610-640  133    148      106     -
	650-700  141    167      113    130*
	710-800  155    167      112     48*
Table 3. Final Exam scores by ability level.
An asterisk (*) means small sample size
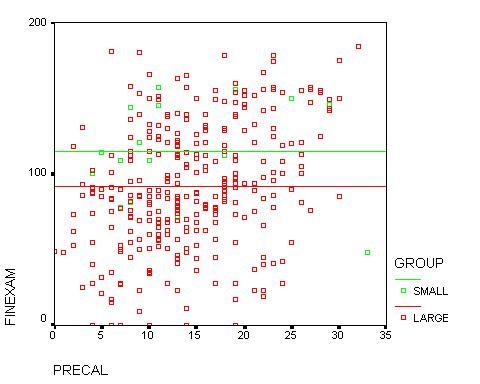
Figure 4: Final Exam Scores versus Placement scores (upper-year students)
CONCLUSIONS:
Any description of the effect of the Practicum format must separate the
first-year students from the upper-year students, and must also take into
account their ability levels, as measured for example by the placement test.
References
[W] C. Weibel,
Effectiveness of Rutgers' Calculus Formats - Part I, 1999.
weibel @
math.rutgers.edu