In the last few years, the Math department at Rutgers has changed the way it teaches Calculus. This is especially true in the Calculus sequence for the Mathematical and Physical Sciences, Math 151-152.
This is the first of two studies undertaken by the Mathematics Department, as an attempt to determine the relative effect of the new formats. We restrict it to a comparison of the different formats in which we teach Math 151-152. A second report will compare these formats to the old lecture/recitation style we had traditionally used, using data from the Calculus sequence Math 135-136.
Since 1996, we have taught Math 151-152 in 3 comparable formats: the standard 4-credit sections (taken by most students), the 5-credit sections with attached "Practicum" (numbered Math 157-158) and the 6-credit "Excel" sections (which are actually Math 153-154).
To measure the effectiveness of these different formats, we used the common final exam scores for each semester. This test was taken during finals week by almost all students in these courses; the small percentage who needed a make-up test were excluded from our data. In both semesters, the final exam was scored on a scale of 0-200 points.
Here is a brief description of what we found.
We will quantify these conculsions below.
In Spring 1998 the final exam was taken by 540 students and had an average
score of 131 points; only 95 received an 'F' on this exam. A large part of
the reason for the different student profile in Calculus II is that many of
the weaker students in Calculus I were filtered out; the average final exam
score in Math 151 among continuing students was 128, not 116.
We found clear differences in performance between students' scores on
the Math 152 final exam in Spring 1998 (see Table 1).
The differences between the means of these groups is significant at the
usual 95% confidence level, because the Standard Errors (the standard
deviations of the means) in this table are much smaller than the
differences between the observed means.
In both semesters, there is an obvious point to be made: this analysis of
average scores is suspect because it does not take precalculus skills or
aptitude into consideration. This information was available to us in the
form of placement information.
In 1990, Rutgers initiated a 6-credit pilot program called EXCEL for
first-year calculus students. Based on a program at Berkeley, it replaces
the one recitation with three full periods per week devoted to workshops.
The workshops involve collaborative learning in small groups of 3-4 students.
In addition, students are now being asked to write up expository solutions,
explaining in complete sentences how they arrive at their answer.
EXCEL was an immediate success. Not only did we notice an increase in
grade point averages over several years, but we also observed fewer losses
in the number of technical majors. In addition, other departments have
supported EXCEL because they have found that EXCEL students were better
able to engage in collaborative learning projects. Since 1990, EXCEL has
become a standard course offering, and given the designation Math 153-154.
Encouraged by the success of the EXCEL program, the Math department changed
the way it teaches Calculus, starting in Fall 1995. In order to keep the
4-credit course load, each section of Math 151-152 meets 3 times per
week, with two 80-minute periods being devoted to traditional lectures.
In the third period, increased from 55 to 80 minutes, the students meet
in a recitation/workshop format. These classes are led by a teaching
assistant (TA) and a carefully selected undergraduate, called a Peer Mentor.
Typically, the first 20 minutes are spent going over the routine homework
problems. In the remaining hour, the students break up into small workshop
groups (of 3-4 people) and attempt more challenging problems, which are
distributed as a handout. One of these workshop problems is assigned to be
written up in the next week, and graded for both mathematics and exposition.
Starting in Fall 1996, a 5-credit version of Math 151-152 was created.
Again, two 80-minute periods are devoted to traditional lectures.
In addition, the students meet twice a week in 55-minute classes. One
class is a traditional recitation, in which a teaching assistant (TA)
goes over the routine homework. The other 55-minute class is held in the
workshop format described above, and run by the Lecturer and a Peer Mentor.
We will refer to this as the "Practicum" format, since one 55-minute class
each is afflicted with a separate course number (Math 157-158) and the
name Practicum by the University Registrar.
In order to take Calculus I at Rutgers-New Brunswick, all students must
either pass the New Brunswick Precalculus placement exam (the NBPRE) or
else have passed a precalculus course. The NBPRE is scored from 0 to 40;
a score of 19 or higher qualifies them to take calculus. We had the NBPRE
scores for all first-year students, but not for all upper-class students.
The average NBPRE score was 27.0 for the first-year students in our sample.
About 1% of all first-year students had lower NBPRE scores, but were
allowed into Math 151 if they had taken Precalculus over the Summer.
In addition, our database contained admissions information.
We had both the Math SAT (MSAT) and Verbal SAT (VSAT) scores
for all first-year students in our database, scored from 200-800.
We also had their High School Rank (HSR), measured as a percentage from
0-100, their gender (male/female) and school of admission.
The average MSAT score in our sample was 650; almost all students in
Math 151 (excluding EXCEL) had an MSAT of over 580. To no one's surprise,
we determined that the VSAT score was not a significant predictor of the
final exam scores. The average high school rank was HSR=81.4%, with the
first and third quartiles being 72.8% and 93%, respectively.
For Fall Semester, there was little statistical difference between the
placement scores of the first-year students taking the standard sections
and the practicum sections. This is illustrated in Table 2.
However, the profiles for the students in EXCEL were different.
This was no accident: selection into EXCEL is done by each College (primarily
Douglass College or the Engineering College) on the basis of these numbers.
An analysis of these scores yields the following table.
Comparing the Standard Error with the means, we see that only the
mean for the Practicum sections is significantly higher. However, this
does not mean that there are no differences -- because the mean does not
take a student's prior skill level into consideration.
Using only the NBPRE placement scores for first-year students,
a regression for the final exam score F151 yielded the best linear fits:
After adjusting for the placement scores, we see that weak students did much
better (16-18 points better) in the Practicum and Excel sections, with the
students in EXCEL doing slightly better. The same is true for students with
average and high placement scores.
Here is a scatter plot of NBPRE placement scores versus 151 final exam scores.
This model is one more confirmation of the success we have seen in EXCEL,
and which has been documented before. Because the number of students in
EXCEL was so small, and had a different profile, we excluded EXCEL (Math 153)
from the rest of the study. Since 45 of the 46 students in EXCEL were
first-year students, the main study which excluded Math 153 contained
560 first-year students. Out of these, we had full placement information
for 545 students.
One such study is
"Prediction of Grades in College Mathematics Courses as a
Component of the Placement Validity of SAT-Mathematics Scores," by
B. Bridgeman and C. Walker of ETS (published by the College Board in 1990).
In their study, they found that local placement tests like the NBPRE
have a good correlation (about .5) with Calculus grades. In contrast,
the MSAT, which is only a general measure of mathematical aptitude,
only had a correlation of about .35 with Calculus grades.
The NBPRE and MSAT scores are not independent variables;
the correlation between NBPRE and MSAT was .49 for the first-year students
in our study. In addition, the MSAT is a factor in admission to Rutgers,
while the NBPRE scores are used in placement into Calculus and Precalculus
classes at Rutgers-New Brunswick.
We performed a Factor Analysis on the variables F151, NBPRE, MSAT and HSR
in order to determine if there was a better indicator variable.
It turned out that there were two significant factors, with eigenvalues
2.1 and 1.0. The most significant factor was:
(F151, NBPRE, MSAT, HSR) = (.78, .28, .82, .87).
The secondary factor was essentially the HSR. To test the effect of this
factor, we defined two new predictor variables,
NEWP = (0.87)NBPRE + (0.82)MSAT + (.28)HSR,
This had correlation coefficients of .56 and .55 with the final exam scores
F151 of the first-year students, compared with the correlation of .52 for
the NBPRE alone. We confirmed by visual inspection of the scatter plots of
the data that there was not a real difference between working with NBPRE of
the factors NEWP or REGR.
Apparently this was because 90% of the scatter was absorbed by the NBPRE.
FINAL = (9.0)LORP + (3.37)NBPRE + (.45)HSR + (0.169)MSAT - 121.2
In summary, given identical placement data, a student in the practicum
sections could expect to score about 9 points higher on the final exam.
Clearly the students who had not taken Calculus I in the previous semester
("none") did not fare as well. Students who had taken Math 135 also had
lower scores, but this was not statistically significant. Since it seemed
clear from the data (and experience) that the performance in the Calculus I
course was significant, we excluded these students from further study.
Next, we analyzed the data for the students in Math 154 (EXCEL).
Of these, 24 students had taken Math 153 (EXCEL) in the fall, and 21
had taken Math 151 (17 took the 4-credit, and four students took the
5-credit version of Math 151). One student had taken Math 152 in the Fall,
and did very poorly on the final, so we excluded him as an outlier. Faced
with these small numbers, we had to content ourselves with general trends.
For these 45 students, the average score was 145.9, significantly higher
than the scores of students who had never been in EXCEL. This included
6 students who flunked the final exam (scored below 95 points); all of them
had also flunked the final exam the previous semester. The 21 who came from
Math 151 into EXCEL averaged 150 on the final, with no significant correlation
to their performance on the 151 final exam. The 24 who took EXCEL both
semesters had an average final score of 146.5, and there was a significant
correlation with the Math 153 final score (F153):
When we restricted to first-year students with full placement data,
who took Math 151 in the Fall, and excluded the 45 students in
EXCEL (Math 154), we had 316 students in the study.
In Spring 1998 we had final exam data for 540 students. However,
since we wanted to analyze the effect of the previous semester's final,
and we wanted to exclude EXCEL, we had only 388 students in our study.
This included 348 first-year students, for which we had both the Math 151
final score and all placement information. There were 91 other first-year
students with incomplete data which we ignored.
Here is a scatter plot of 151 final exam scores vesus 152 final exam scores.
We considered the LL group (students in the standard 4-credit version both
semesters) as our control group. The correlation between the Fall and
Spring final exams scores was reasonable (.54), and there was a concomitant
correlation with the MSAT and NBPRE scores (the correlations were between
.4 and .44).
Clearly the worst scores are in the PL group, the group of 45 students who
went from the Practicum to the Standard sections. In searching for features
of this group that might explain this, we observed that their final exam
scores were almost independent of the MSAT and NBPRE scores (the correlations
were .01 and .17).
The LP group, consisting of 50 students who switched from the Standard
sections to the Practicum sections, was equally interesting. Their
scores were significantly higher than those in the control group.
Here the curious feature was that the Math 151 final score was almost
independent of the predictors MSAT and NBPRE (the correlations here were
.17 and -.07, respectively).
The best performers were in the PP group (in the Practicum both semesters).
For this group there was a very strong correlation (.77) between the
Math 151 and 152 final exam scores.
Multiple Regression for Math 152 FINAL
Average Final Scores
In Fall 1997, the final exam was taken by 700 students and had a mean score
(average) of 116 points; 199 students received an 'F' on this exam. There was
no significant difference between average scores of the 4-credit sections
and the 6-credit (EXCEL) sections (114 versus 116), but the average score
for the 5-credit Practicum sections was 125, which is significantly higher.
Class		# of   Average(mean)	    QUARTILES	    Standard
Format		Exams and Std. Error	First Median Third  Deviation
------		----  -------------	----- ------ -----  -------
All sections	540	130.6 (1.7)	 107   136   165      40
Standard	378	127.5 (1.9)	 102   130   156      37
Practicum	120	134.8 (3.3)	 112   139   167      36
Excel (154)	 42	146.5 (5.0)	 130   152   167      33
Table 1. Final Exams from Math 152 in Spring 1998
The Formats used in the courses
Until recently, all Calculus at Rutgers was taught in a traditional
4-credit format, consisting of two 80-minute lectures and one 55-minute
recitation each week. Most sections of Calculus 135-136 are still taught
that way, but this is no longer the case with Math 151-152.
Placement Information
We had a large database of placement scores for first-year students,
which we were able to combine with the final exam scores for the first
and second semesters of Calculus.
Class Format	# FY	 NBPRE MSAT HSR
------		-------	 ----- ---- ----
All sections	605	 27.04 650  81.4
Standard	408	 27.43 653  82.1
Practicum	152	 27.12 664  81.6
Excel (153)	 45	 23.30 570  74.3
Table 2. Placement statistics for
first-year students in Fall 1997
The First Semester Results
In Fall 1997 we had final exam data for 689 students, including
605 first-year students. The mean for all students was 116.4 points, and
the mean for first-year students was 120.8 points, not a great difference.
Because we had available the admissions data for first-year students,
and because this information was correlated with final exam scores,
we decided to report our statistical analysis for first-year students.
The analysis of all students was also done, but the results are
qualitatively similar and less complete.
Class		# Exams	    Mean	Std.Error Standard
Format		 ALL(FY)   ALL(FY)	 ALL(FY)  Deviation
------		-------	 ------------	---------  -------
All sections	689(605) 116.4(120.8)	1.7(1.8)   44(43)
Standard	478(408) 113.6(118.7)   2.0(2.2)   45(44)
Practicum	165(152) 124.8(127.8)	3.1(3.0)   39(37)
Excel (153)	 46 (45) 115.8(116.1)	6.0(6.1)   41(41)
Table 3. Final Exams from Math 151 in Fall 1997
 FORMAT		Least squares equation		NBPRE=23  NBPRE=27 NBPRE=31
---------	-------------------------	--------  -------- --------
Standard:  	F151 = (4.87)NBPRE - 15.3	  96.7	   116.2    135.7
Practicum: 	F151 = (3.87)NBPRE + 23.2	 112.2	   127.7    143.2
Excel:     	F151 = (4.16)NBPRE + 18.3	 114.0	   130.6    147.3
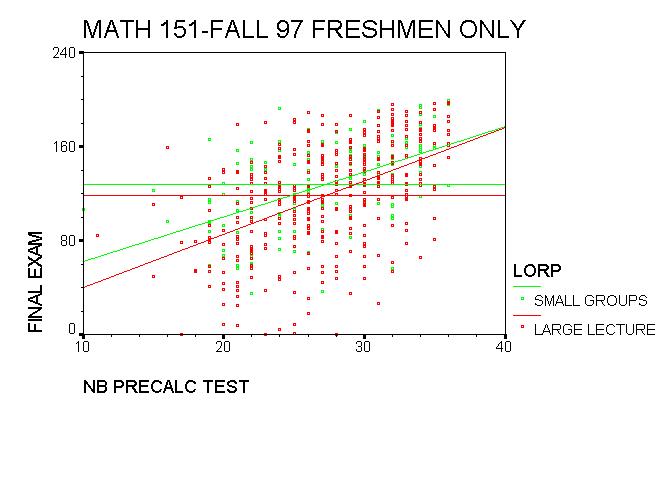
Figure 1: PRECAL placement scores versus 151 Final Exam scores
Finding the Best Predictor
In our study, both the New Brunswick Placement Exam (NBPRE) and the
Math SAT scores (MSAT) were highly correlated with the final exam scores;
their correlation coefficients were .51 and .41, respectively. This suggests
that we use a combination of the NBPRE and MSAT scores as a predictor of the
final exam scores. This is supported by research studies which show that
both the NBPRE and MSAT scores are indicators of performance in Calculus.
REGR = (3.37)NBPRE + (1.69)MSAT + (.45)HSR.
Lecture or Practicum?
We also ran a more sophisticated stepwise linear regression, using the
t-test to decide which variables are significant. This showed that the
High School Rank (HSR) was just as important as MSAT scores in predicting
final exam scores. To determine the effect of the format, we introduced
the indicator variable LORP, defined to be zero for Standard
sections and one for Practicum sections. The best linear fit was:
The Second Semester Results
In Spring 1998 we had 543 students take the Math 152-154 common final exam.
In addition to placement information, it was important to know which
Calculus course they had taken in the previous semester. There were
115 students did not take Calculus I in the fall, 22 who had taken Math 135,
the other Calculus I class offered by Rutgers, leaving only 406 students
who had taken Math 151-3 in the Fall. Their scores on the final exam (F152)
are summarized in the following table.
  Two-term   #    F152	std.   std.   Two-term   #    F152   std.   std.
  Sequence Exams  mean	error  dev.   Sequence Exams  mean  error   dev.
  -------- -----  ----	-----  ---    -------- -----  ----- -----   ---
   any-152: 543	  131	 1.7   39	151-154:   21  145.4   6.8    31
  none-152: 115   125	 3.5   38       153-154:   24  146.5   6.7    33
   135-152:  22   129.6	 7.7   36       153-152:   26  141.5   7.1    36
   151-152: 406   134	 1.9   38
Table 5. Final exams in Spring 1998 by Course Sequence
	Least squares equation		F153 score: 100;  116;  130;  150
  EXCEL 154 FINAL = (0.58)F153 + 79.2	            137.2 146.5 154.6 166.2
By visual inspection of the scatter plot, it appeared that this equation
gave a good fit for the best students, and was not skewed by the
six poor students in the sample. The slope of this line was similar
to that of the least squares lines for Math 151-152 below, reflecting the
reality that the final exam for Calculus I is a good predictor of the
final exam score for Calculus II.
151/152		#     152   Std. Std.   F151
Formats		Exams Mean  Err. Dev.   Mean  NBPRE
------		----- ----- ---- ----   ----  -----
All sections	388   132.4 1.7	 37.5	130.3  28.2
LL (control)	251   130.3 2.5	 36.8	129.0  28.3
PL		 45   111.4 6.2	 41.9	126.7  26.2
LP		 50   144.5 5.2	 36.8	128.4  29.0
PP		 42   152.9 5.8	 37.6	144.6  28.5
Table 6. Final Exams in Spring 1998
All students, by format in both semesters
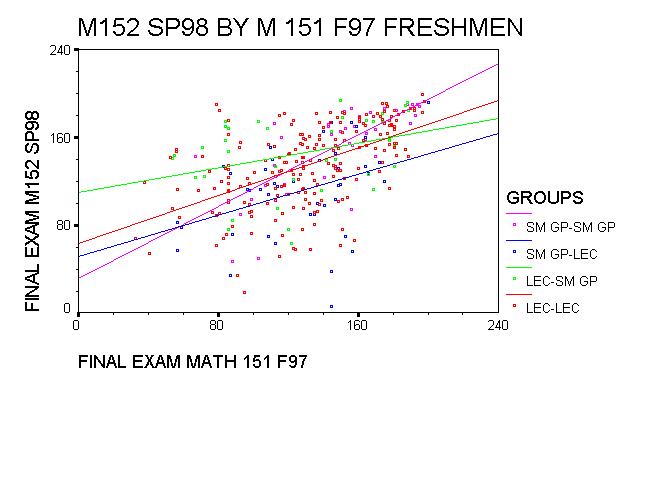
Figure 2: Final Exam Scores: Calc I versus Calc II
versus Math 151 Final (F151), NBPRE, LORP and PRELORP for first-year students.
FINAL = (.543)(F151) + 63.4
= (.432)(F151) + (2.04)NBPRE + (15.2)LORP + C'
= (.450)(F151) + (1.85)NBPRE + (18.9)LORP - (11.7)PRELORP + 22.3
weibel @
math.rutgers.edu