They all show functions that bounce up and down and up and down, and thus are superfically snake-like. However, I beleive they all fail to actually satisfy the definition of the pseudo-arc.
These are meant to illustrate the naive confusion that arises if one just skims Lewis and Minic paper Drawing the pseudo-arc, looking at the pretty pictures, but without bothering to read it. If you do read and ponder it, it turns out the fractal-like shapes in that paper are not at all of the usual variety, as explained in the commentary to an Azimuth post.
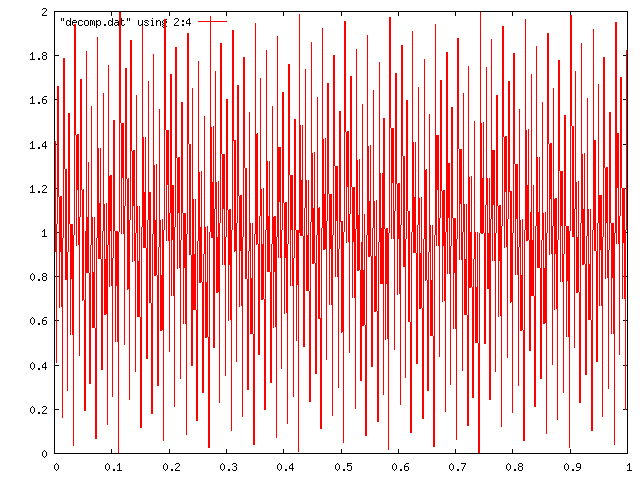
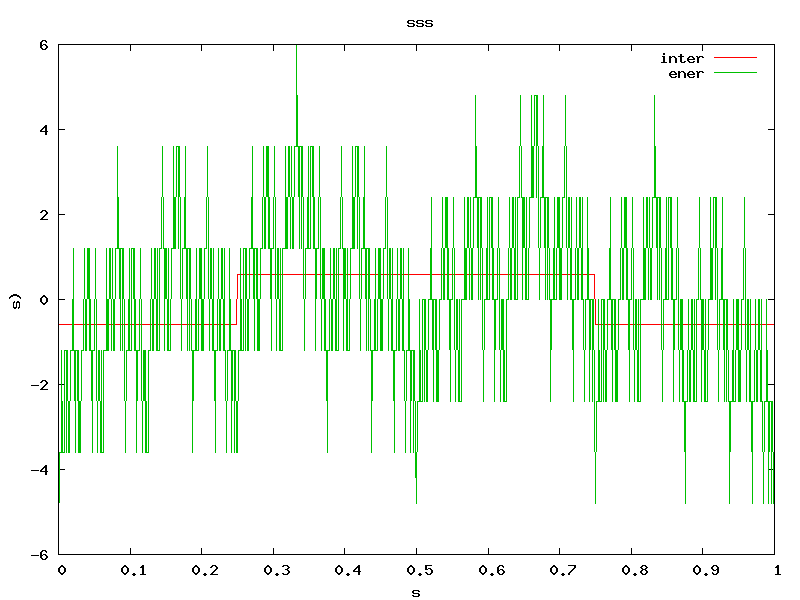
The first graph below shows the energy in a one-dimensional Ising model with long-range pair interactions. The interaction potential is in red. The green line is the energy (Hamiltonian).
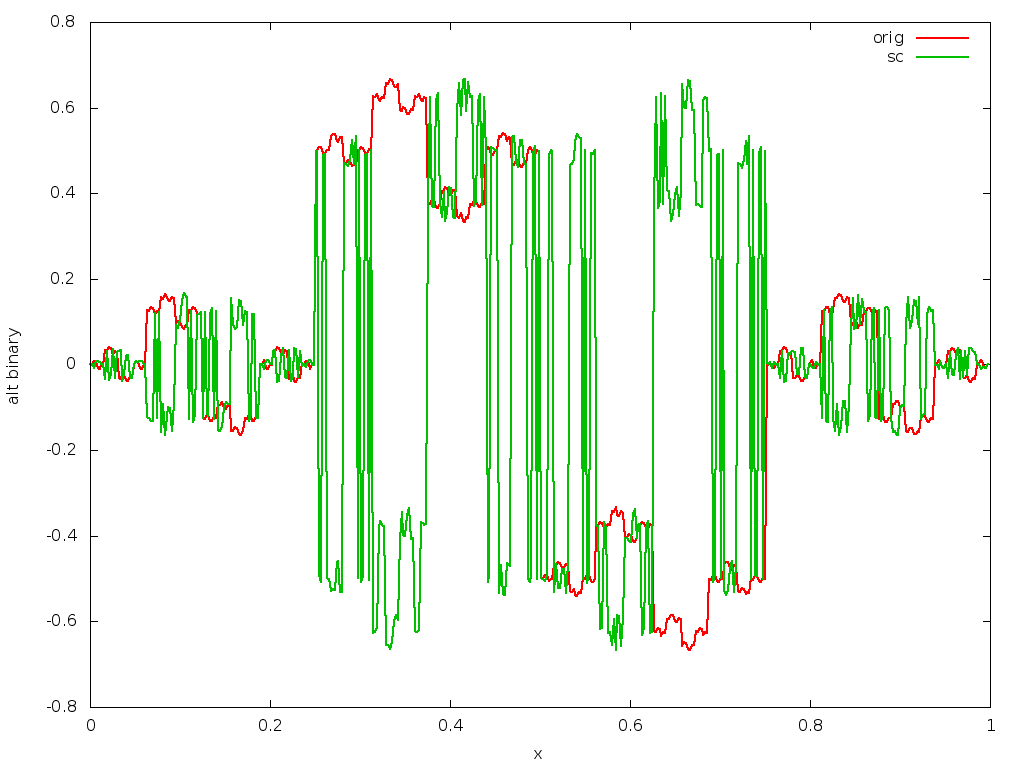
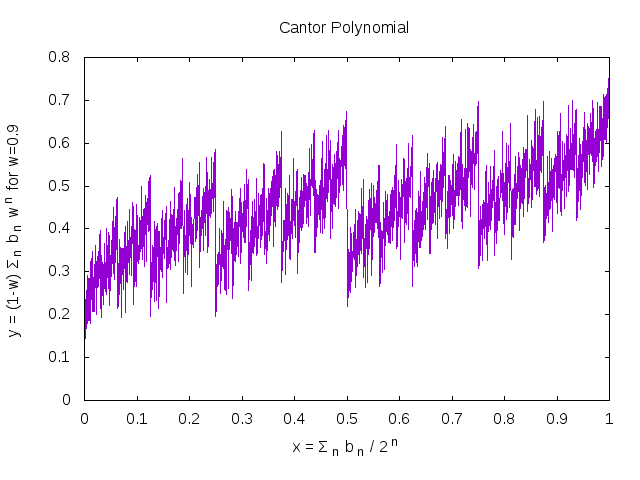
The below is well-known and easy: the bn are the binary digits in the expansion of x. Note that this curve is discontinuous at all dyadic rationals.
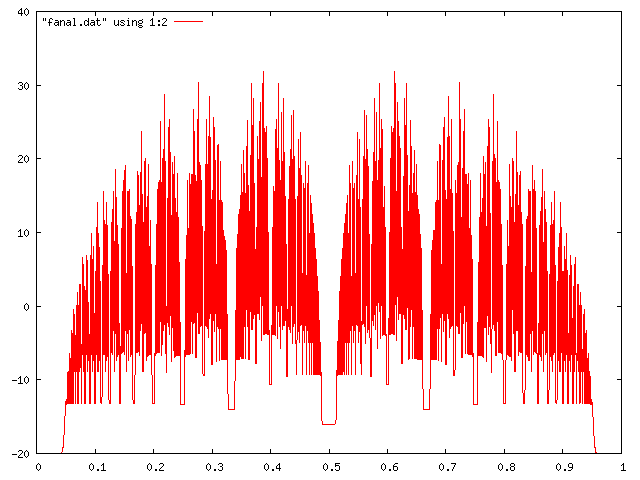
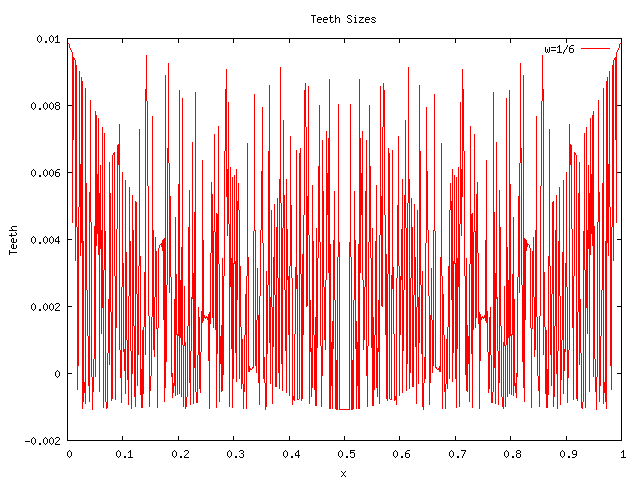
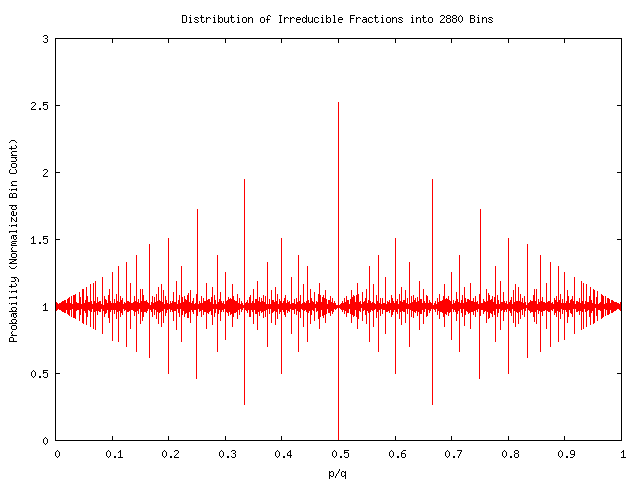
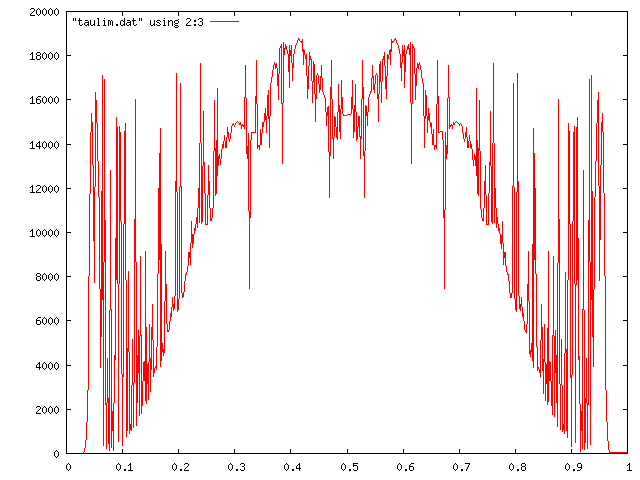
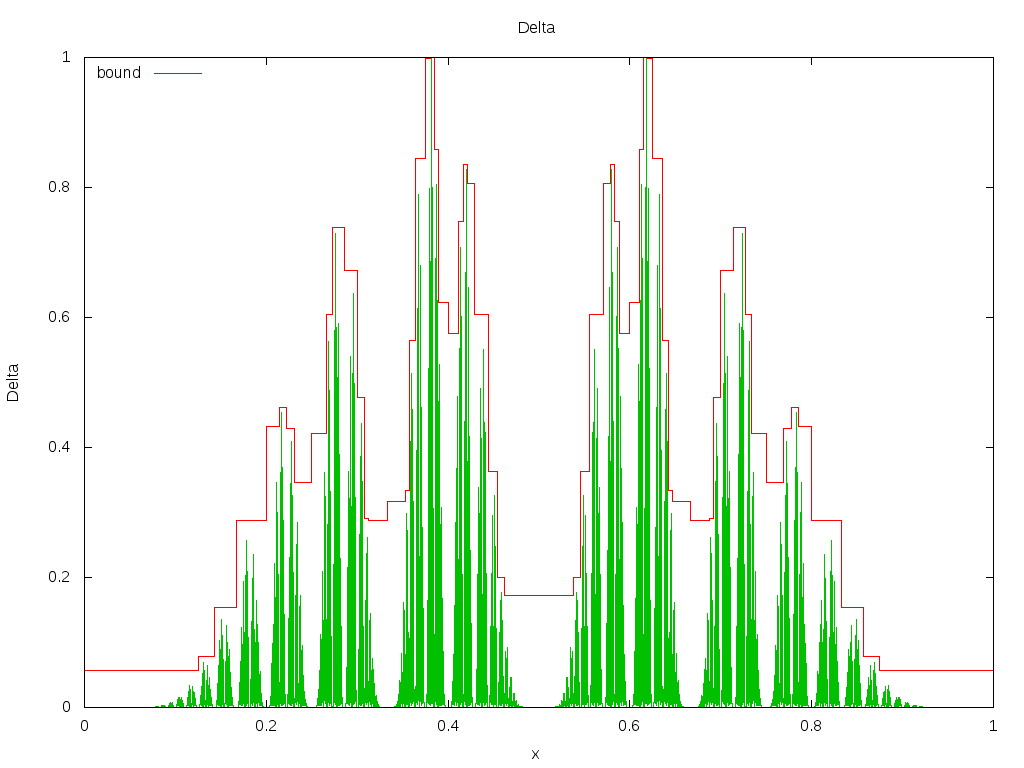
An upper bound for the Minkowski measure. Note that in the limit, each spike is infinitely tall, and are everywhere dense: there is a spike at each irrational number, and a zero at each rational. Thus, one possible way to draw this limit is to draw a line that goes from zero to infinity, and back to zero, everywhere. Such a drawing would be accurate, yet misleading, because the spikes are not all of the same weight. In this drawing, the height of each spike is in proportion to its weight (mass). Although this function is nowhere continuous, it is integrable, and the integral is the Minkowski Question Mark.
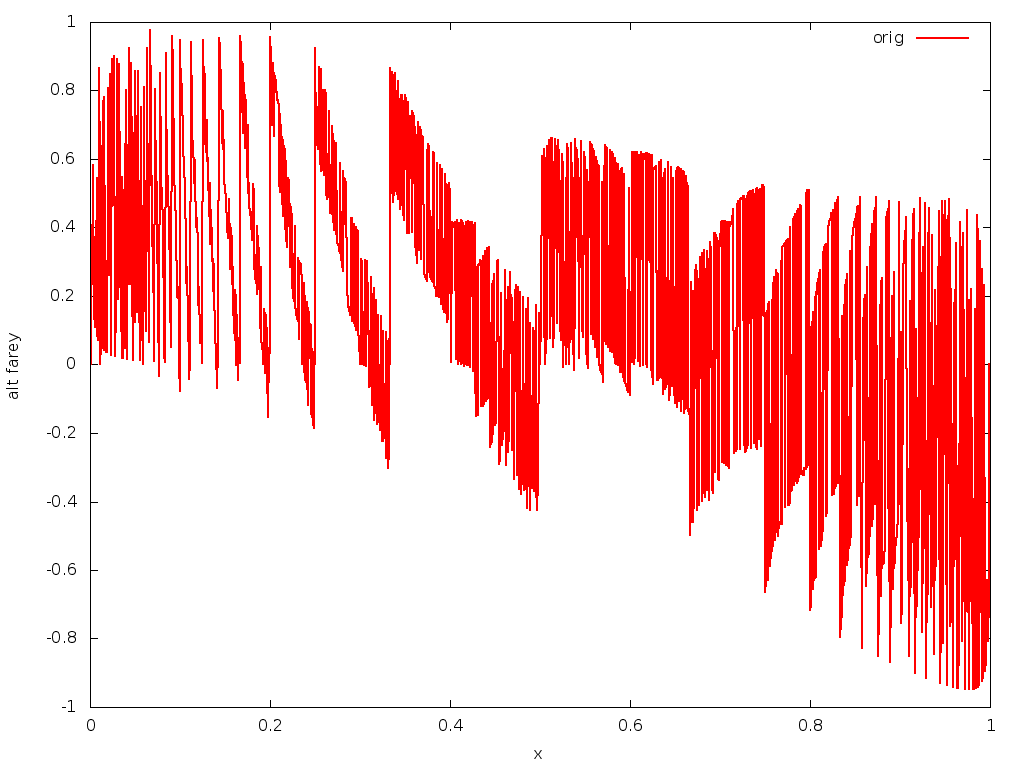
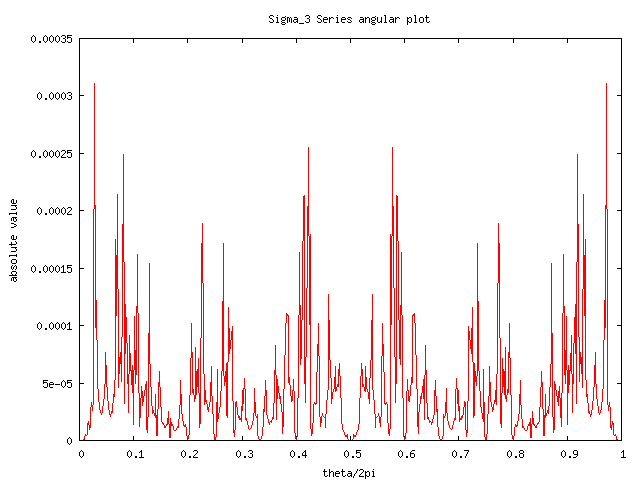
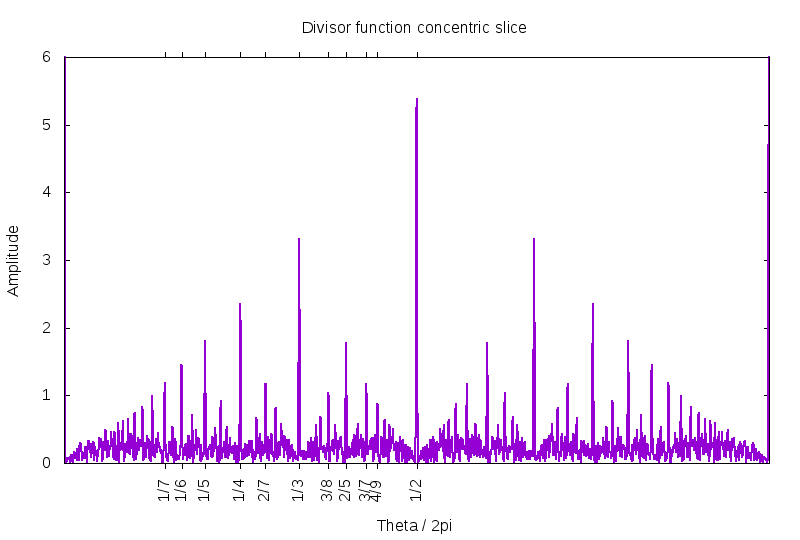
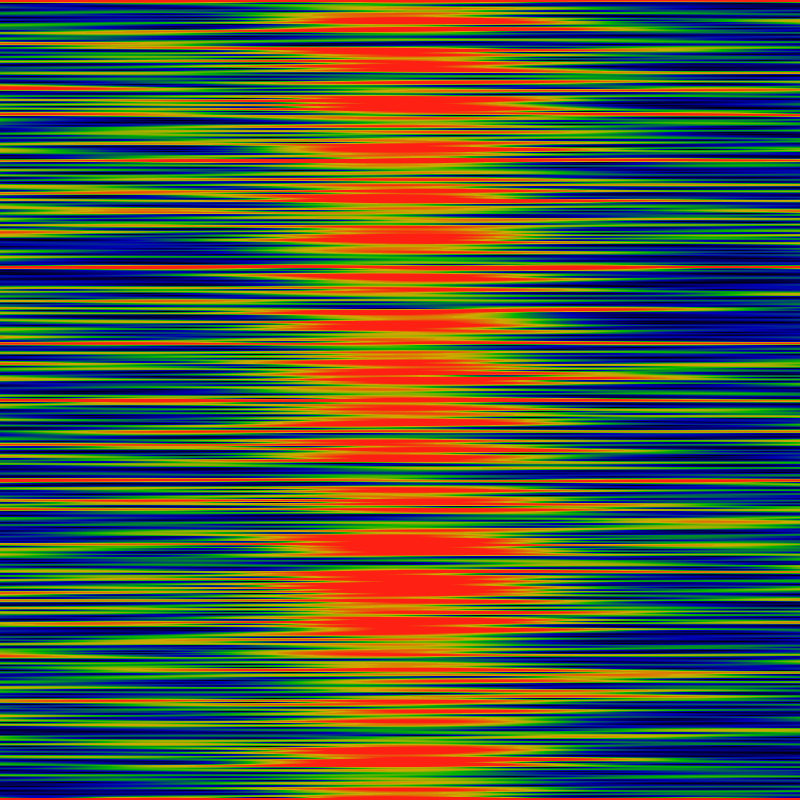
Other miscellaneous failed, unpublished, unexplainable drawings:
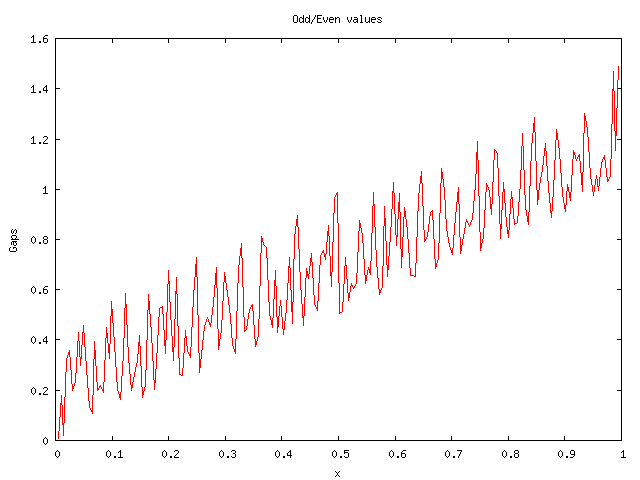
Lots more curves that bounce up and down and up and down and fail to satisfy the definition of the pseudo-arc.