The raw data is here. It seems to be accurate to maybe three or four decimal places. The data seems to be fit with about 5% accuracy with the equation
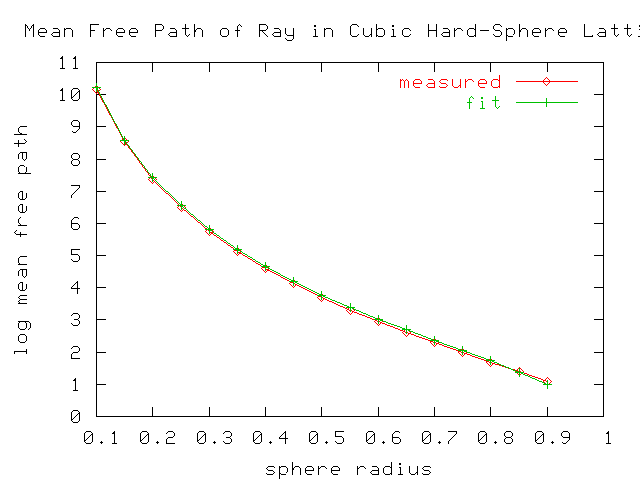
The following graph shows an experimental result, and a suitable fit
to the data that was guessed at.
The raw data is here. It seems to be accurate
to maybe three or four decimal places. The data seems to be fit with
about 5% accuracy with the equation
mfp = exp (1-r8) / r4where r is the sphere radius and the lattice is two units on a side. The green line in the graph (labelled 'fit') is a graph of this formula. I have no idea as to whether this is a well-known result or not; most technical papers on the web speak at a far more complex level, and introductory texts are not available on the web, or in my library. I don't know whether this formula has the right asymptotic behavior as r->0 or r >~ 1. (Because this is a three dimensional lattice, the ball radius can be as large as sqrt(3) before the space is filled, and as large as sqrt(2) before the space becomes disconnected. I don't know if there is a quantitatively different behavior for r > 1.)
Copyright (c) 2002 Linas Vepstas

Mean Free Path in Sinai's Billiards
by Linas Vepstas is licensed under a
Creative Commons
Attribution-ShareAlike 4.0 International License.
To contact Linas, see his
Home Page.